Background
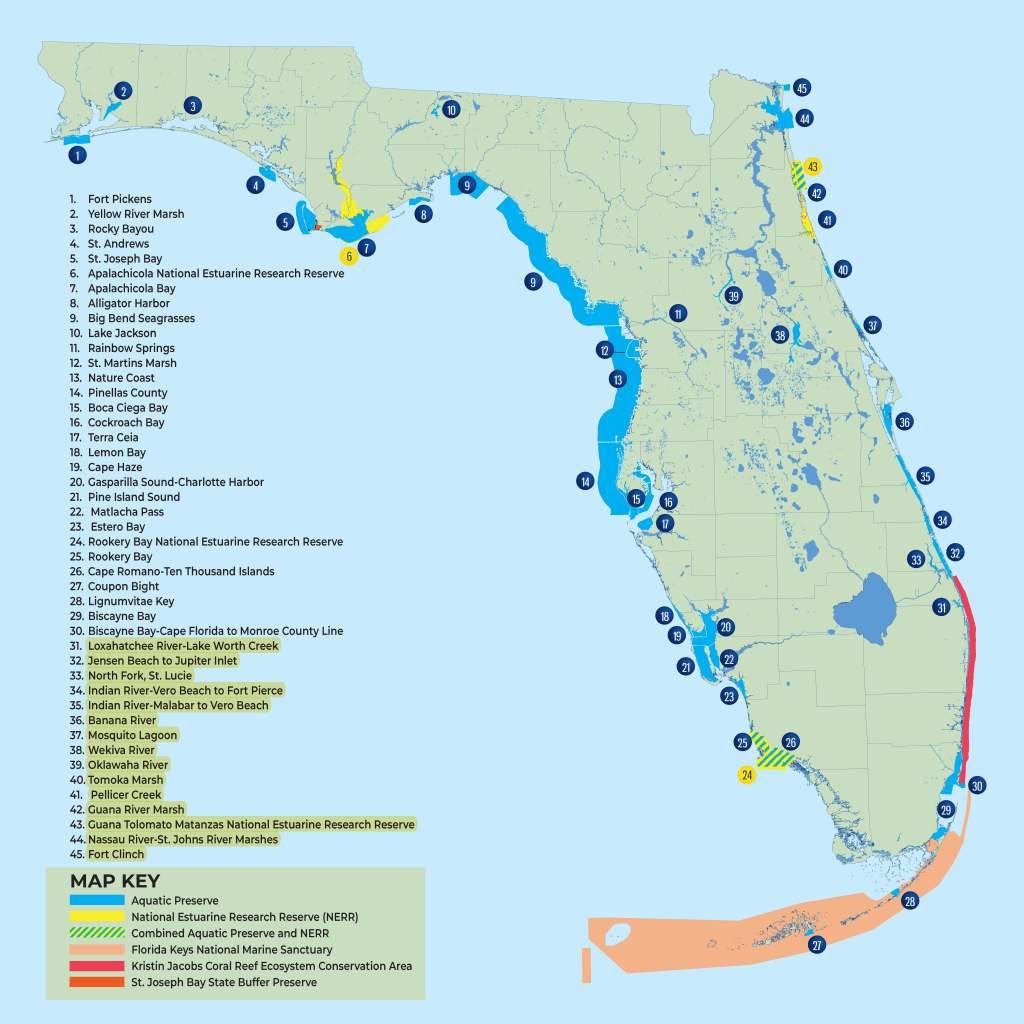
The overall goal of the Florida Aquatic Preserve Use Estimation Study is to estimate annual recreational use occurring in the 41 aquatic preserves throughout the state. This project was configured in five phases. Phase 1 consisted of three components:
1) a literature review and analysis of research methods for estimating recreational use in dispersed areas
2) an assessment of the geographic and social characteristics of each of the 41 aquatic preserves
3) criteria for selecting five aquatic preserves to conduct methodological testing in during Phase 2
Phase 2 of the study was completed in June 2020. Various methods and data sources such as satellite imagery, drone overflights, state and local park use, boat ramp use, and other related facility use data were examined to determine their feasibility and usefulness for estimating recreational use and developing use models for each of the 41 aquatic preserves. This process not only identified the strengths of different methods and data sources, but it also ascertained their conditions for application and associated limitations.
Phases 3 and 4 of the study rolled-out the methods and procedures examined during Phase 2. We quickly learned that many challenges are inherent in in establishing data collection locations, including FAA airspace limitations and restrictions for drone flights, drone flight and time-lapse camera use approvals from local cities and counties when using their lands, and obtaining visitor use data for park visitation and canoe and kayak concession rentals. These were all successfully negotiated; however, it reinforced the need to begin data collection site selection and agency contact prior to beginning Phase 5. We anticipated this need and included it in the Phase 4 scope of work.
Study Sites
Phase 3 Sites: 2020-2021
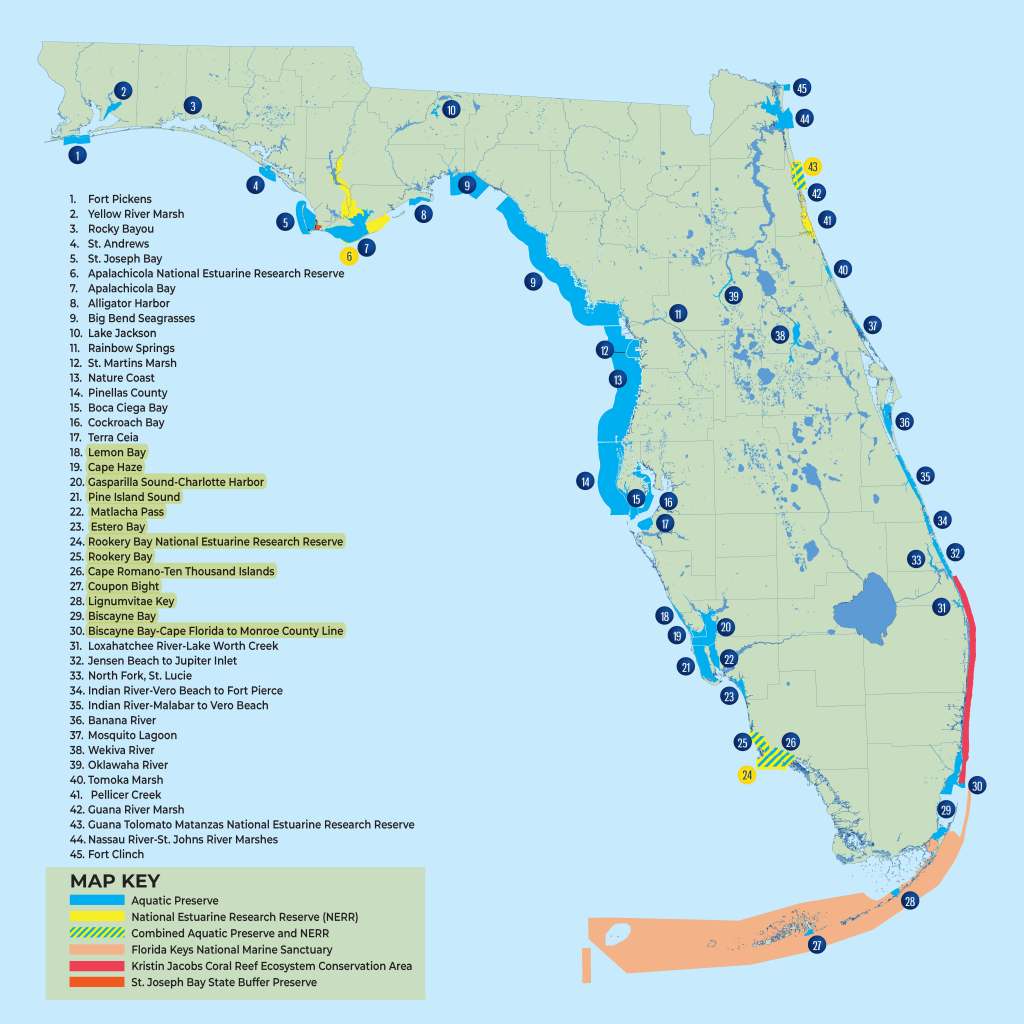
Phase 3 focused on sites #31-45, encompassing the Northeast Florida region.
Phase 4 Sites: 2021-2022
Phase 4 focused on sites #18-30, encompassing the Southwest Florida region.
Phase 5 Sites: 2022-2023
Phase 5 focused on sites #1-17, encompassing the Northwest Florida region.
Phase 5 Scope of Work
Goal
The goal of Phase 5 is to estimate the number of vessels and individuals using aquatic preserve (AP) water and land areas and to develop use models for predicting use during subsequent years. The value of these use models lies in reducing the need to expend significant labor and other resources for data collection activities to annually estimate use. By identifying model inputs from shoreside data sources that significantly predict use during Phase 5 data collection and analysis, future visitor use estimation efforts will be limited to only collecting data from those predictive sources and entering them into the model. This eliminates the need for future aerial and vessel-based use surveys.
During Phase 4, the UF team identified a preliminary list of 117 locations across the 15 APs as potential data collection sites. The UF team will work with AP managers and local agencies to establish viable data collection locations for obtaining visitor use counts and identifying shoreside facilities, such as parks, marinas, and boat ramps where recreational use data can be obtained. The UF team will work with AP managers to develop a sampling schedule that includes high and low use periods and special event days. Inclement weather days will be rescheduled
Data Collection
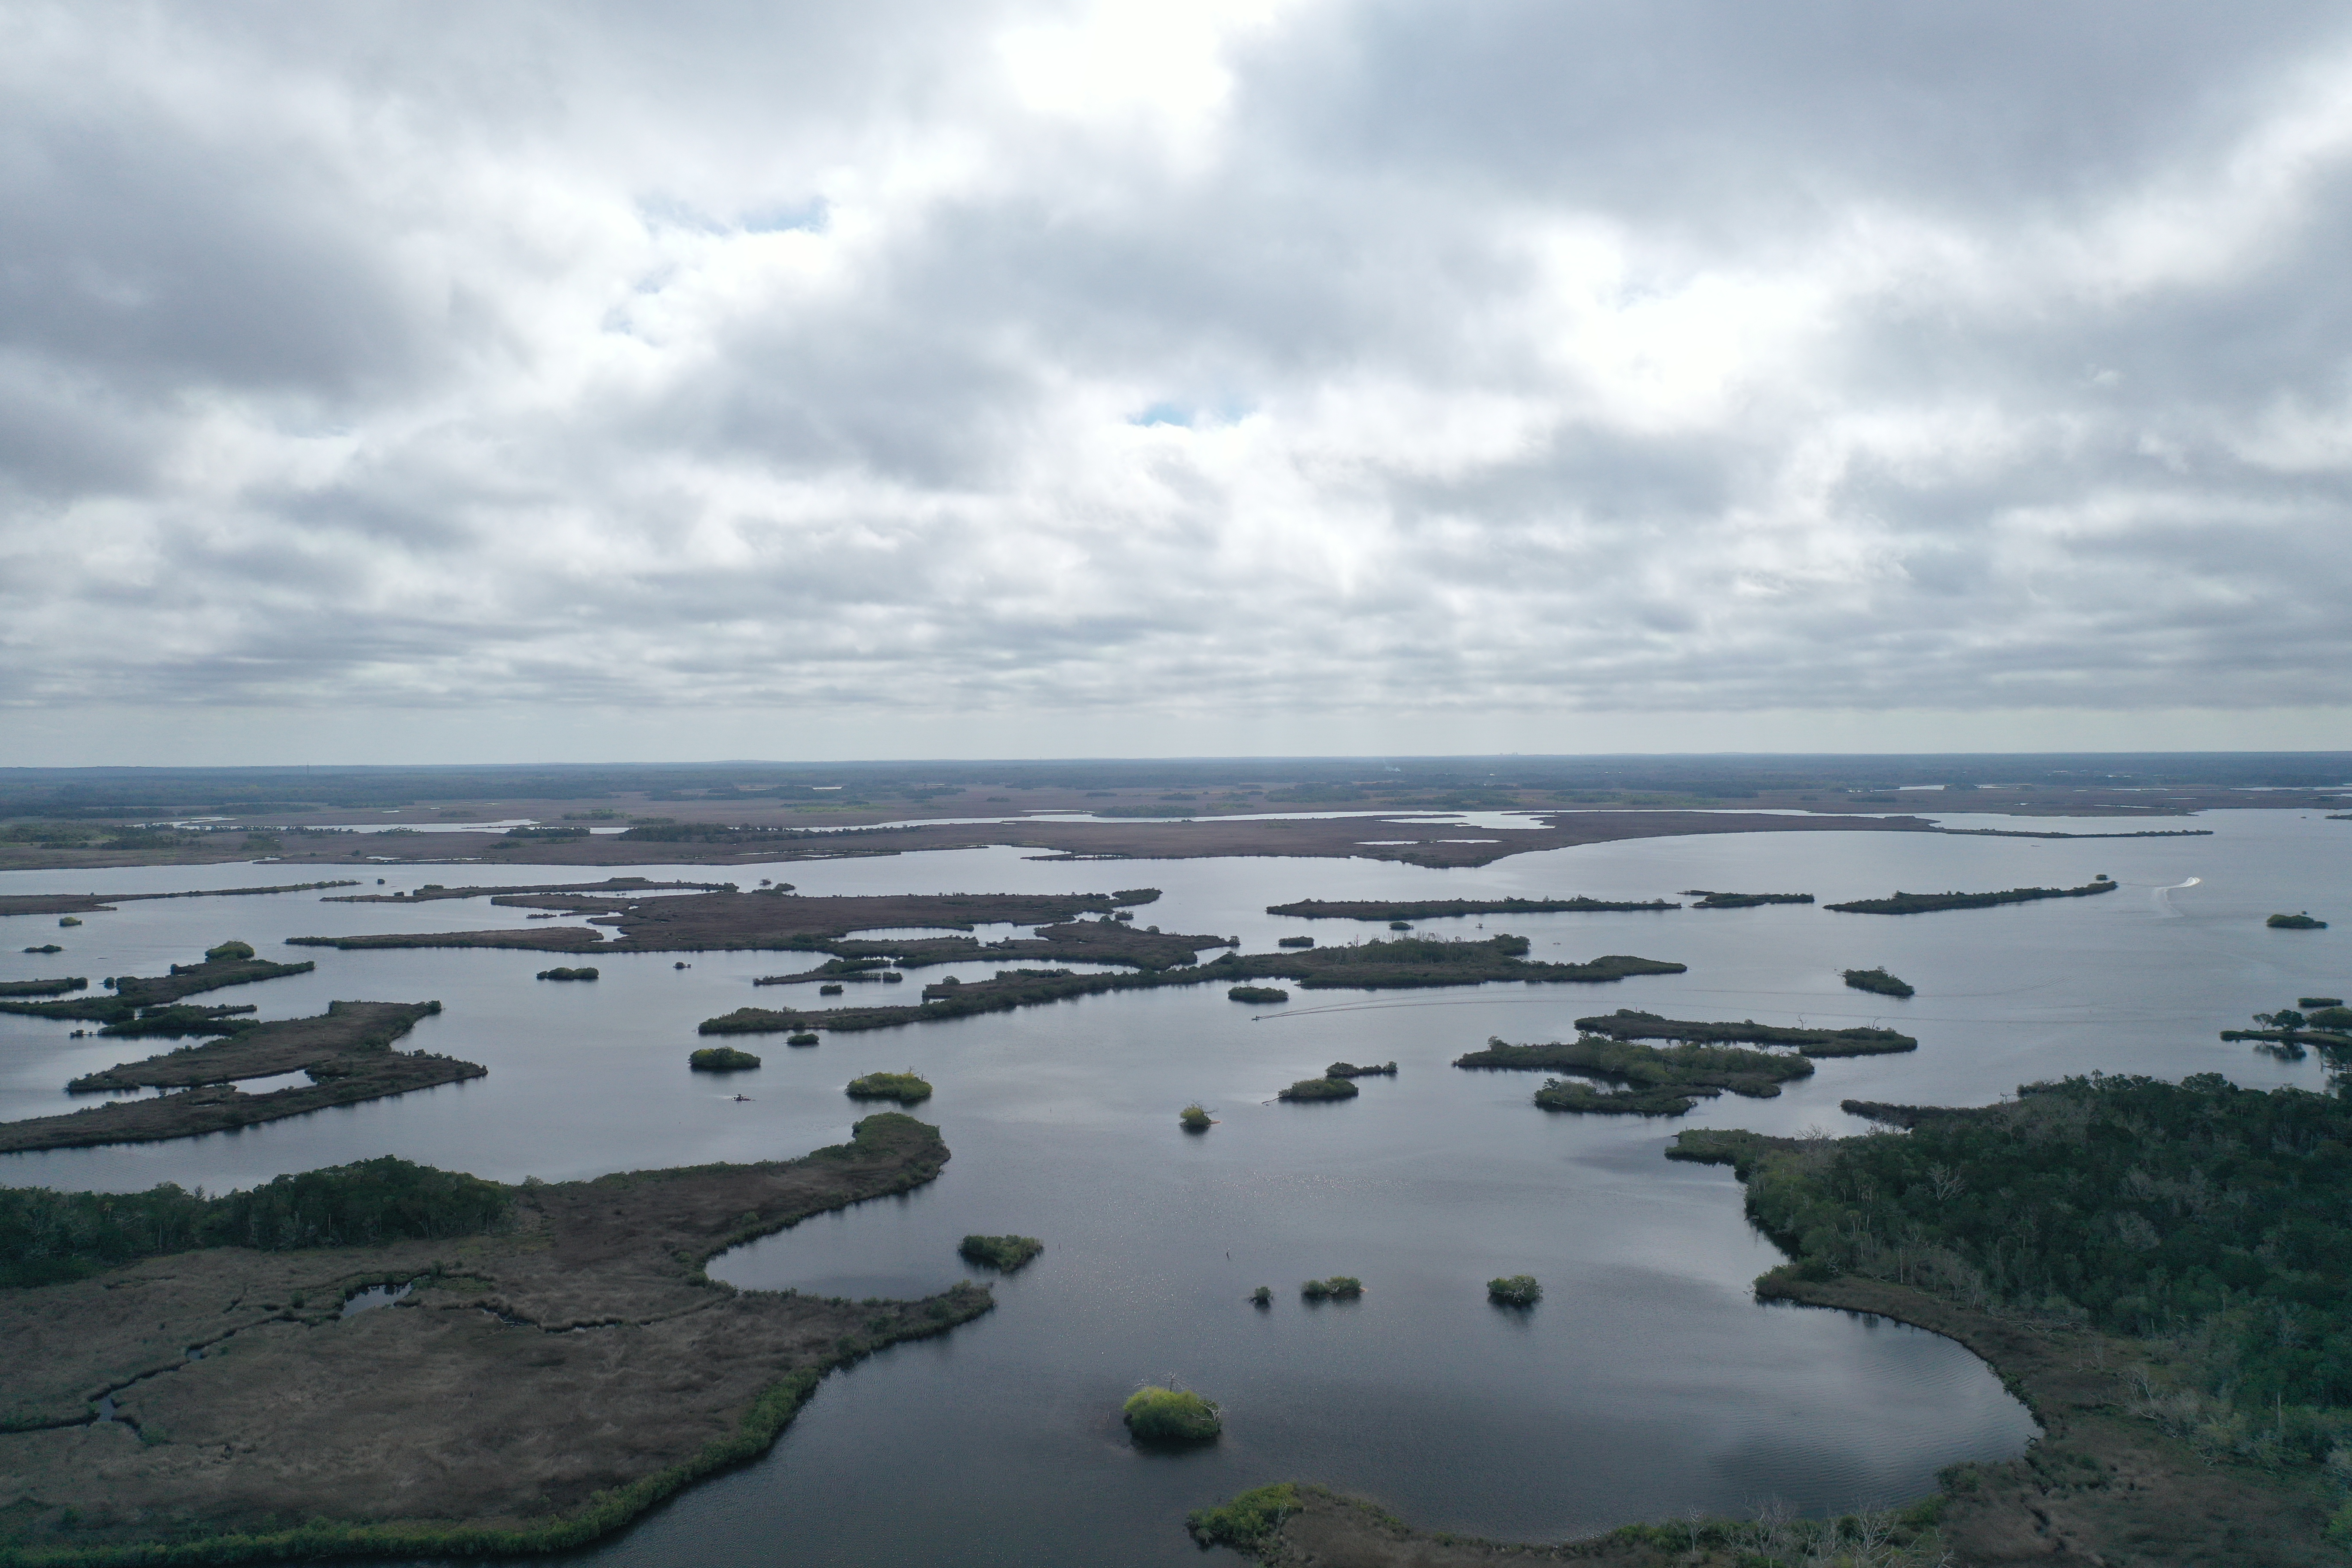
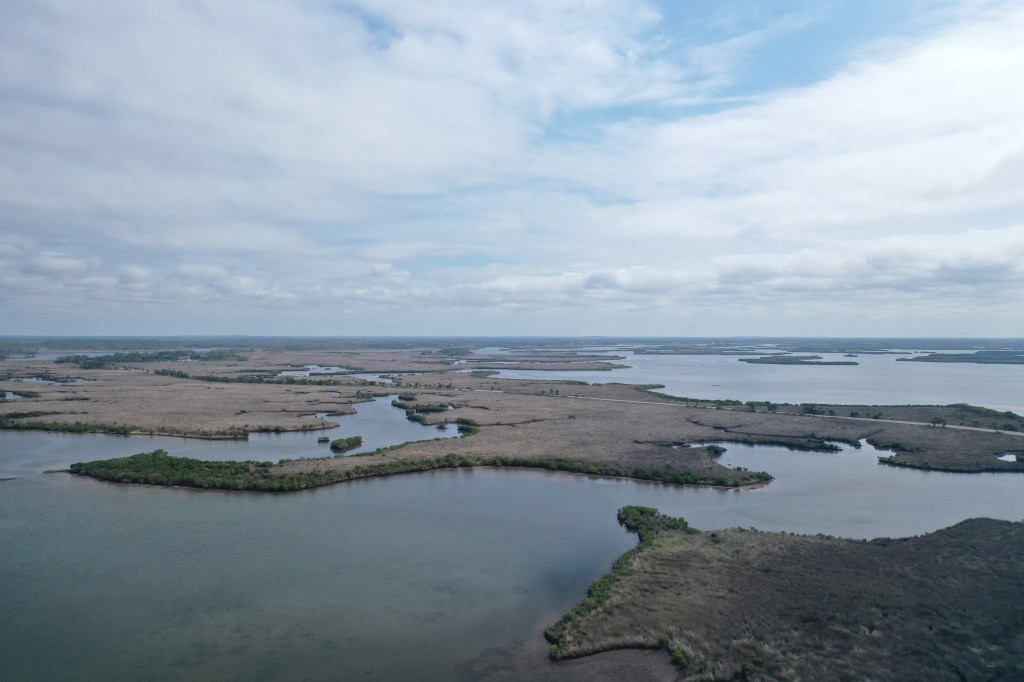
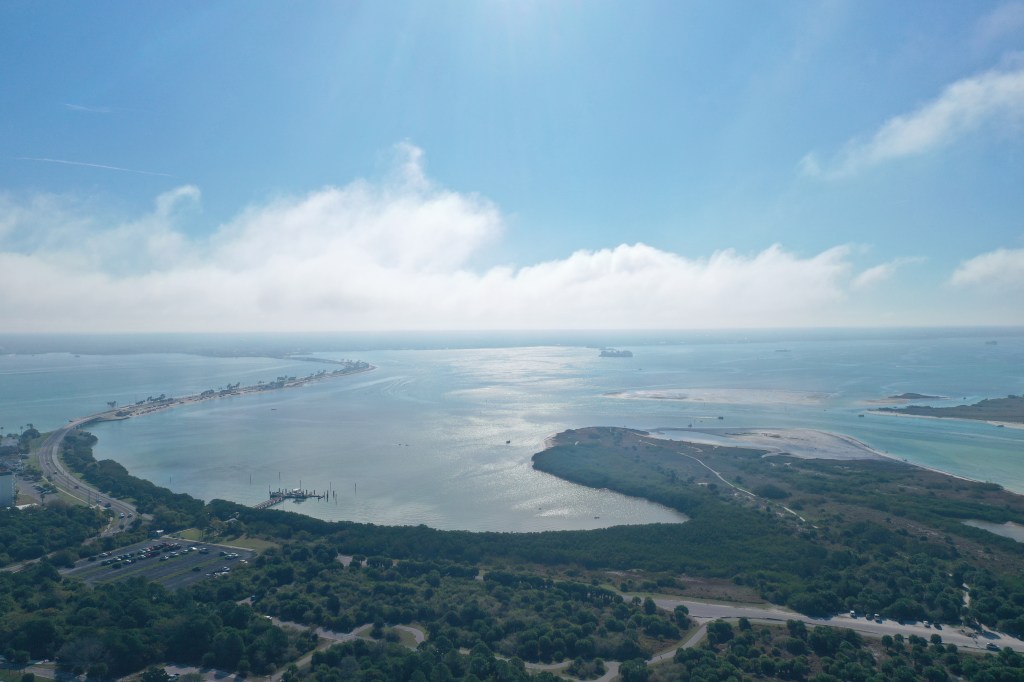
Boat counts will entail using both data from aerial photographs (drones), time-lapse cameras, and human observation. Depending on the size and characteristics of an AP, one or more locations will be established to conduct drone flights to cover significant portions of the AP. Time-lapse cameras will be used at boat ramps to ascertain the temporal order of boats entering and exiting the AP. Cameras will be installed on existing structures, when feasible, in coordination with AP and local agency staff. Data collected at these sites, in conjunction with AP-collected outreach event data, boat ramp and marina use data, state park visitor use data, and other relevant and available data sources, will be used to develop quantitative models to estimate visitor use at each site. Data collection and model development will be informed from Phase 3 and Phase 4 study results.
Once drone flight locations have been approved by NOAA and screened for FAA compliance, and camera locations have been determined, monthly data collection will begin. Data will be collected during one weekend day (alternating Saturday and Sunday) and one weekday (Monday thru Friday) during each month. Each AP will have a minimum of 12 weekend days and 12 weekdays sampled during a year. Where APs are paired for sampling during the same day, morning or afternoon will be alternated across months. That is, if an AP is sampled during the morning one month, data collection at that AP will occur during the afternoon at the next monthly sampling period. The UF team will coordinate with AP managers and staff to determine dates of holiday weekends and weekdays, and special events with expected use increases to include these days with regular use days.
Data Analysis
The UF team will use vessel counts from drone flights, human observation, and boat runs to generate point use estimates to extrapolate to overall AP use based on the proportion of area surveyed to overall area. Boat ramp, park visitation and other shoreside data will be obtained and analyzed by correlating with drone and boat use counts. Use data from low use and remote areas of APs will be collected and integrated into use models to represent use more accurately across an entire AP.
Dr. Tony Fedler will lead the data collection and analysis components of this project. He will be responsible for working directly with AP managers and staff to identify drone flight locations and shoreside facility data collection locations. He will train and direct project staff in data collection procedures and coordinate work during sampling days. He will design recording instruments for drone, boat and time-lapse camera field data. As work at each AP progresses and preliminary analyses are conducted, Dr. Fedler will collaborate with AP staff on model components including drone and boat count coverage, shoreside facility use, and analysis results as models are developed.
Data analysis will consist of correlating shoreside boat ramp, marina, and park use and other data with drone and boat run counts to determine if significant relationships exist. Data from facilities and services (independent variables) correlating significantly with visitor counts (dependent variable) will be used in a multiple regression analysis to determine the contribution of each independent variable in predicting visitor use counts. The regression analysis will identify key shoreside variables that predict AP visitor use and will allow for more efficient data collection by eliminating data sources that do not correlate with drone and boat-based visitor use data.